


About the program
Auburn University, along with 10 nationwide collaborators (Betterbee, Mississippi State University, Oregon State University, Texas A&M University - Bryan, Texas A&M University - Overton, University of Georgia, University of Florida, USDA ARS Baton Rouge Bee Lab, USDA ARS Stoneville Pollinator Unit, and Washington State University) are conducting a multi-site honey bee colony field trial to evaluate Apivar 2.0 versus Apivar for a late-summer varroa mite cleanup treatment. Our goal is to rapidly assess the efficacy and bee safety of Apivar and Apivar 2.0 across multiple regions and environmental conditions by measuring varroa mite infestations, adult bee and brood populations, colony mortality, and whether these interact with environmental conditions.
Current results as of Oct. 27
We will update this page approximately every 2 weeks as we receive data from our collaborators. Expand the sections below to see current results from each of our collaborators.
Average varroa infestation
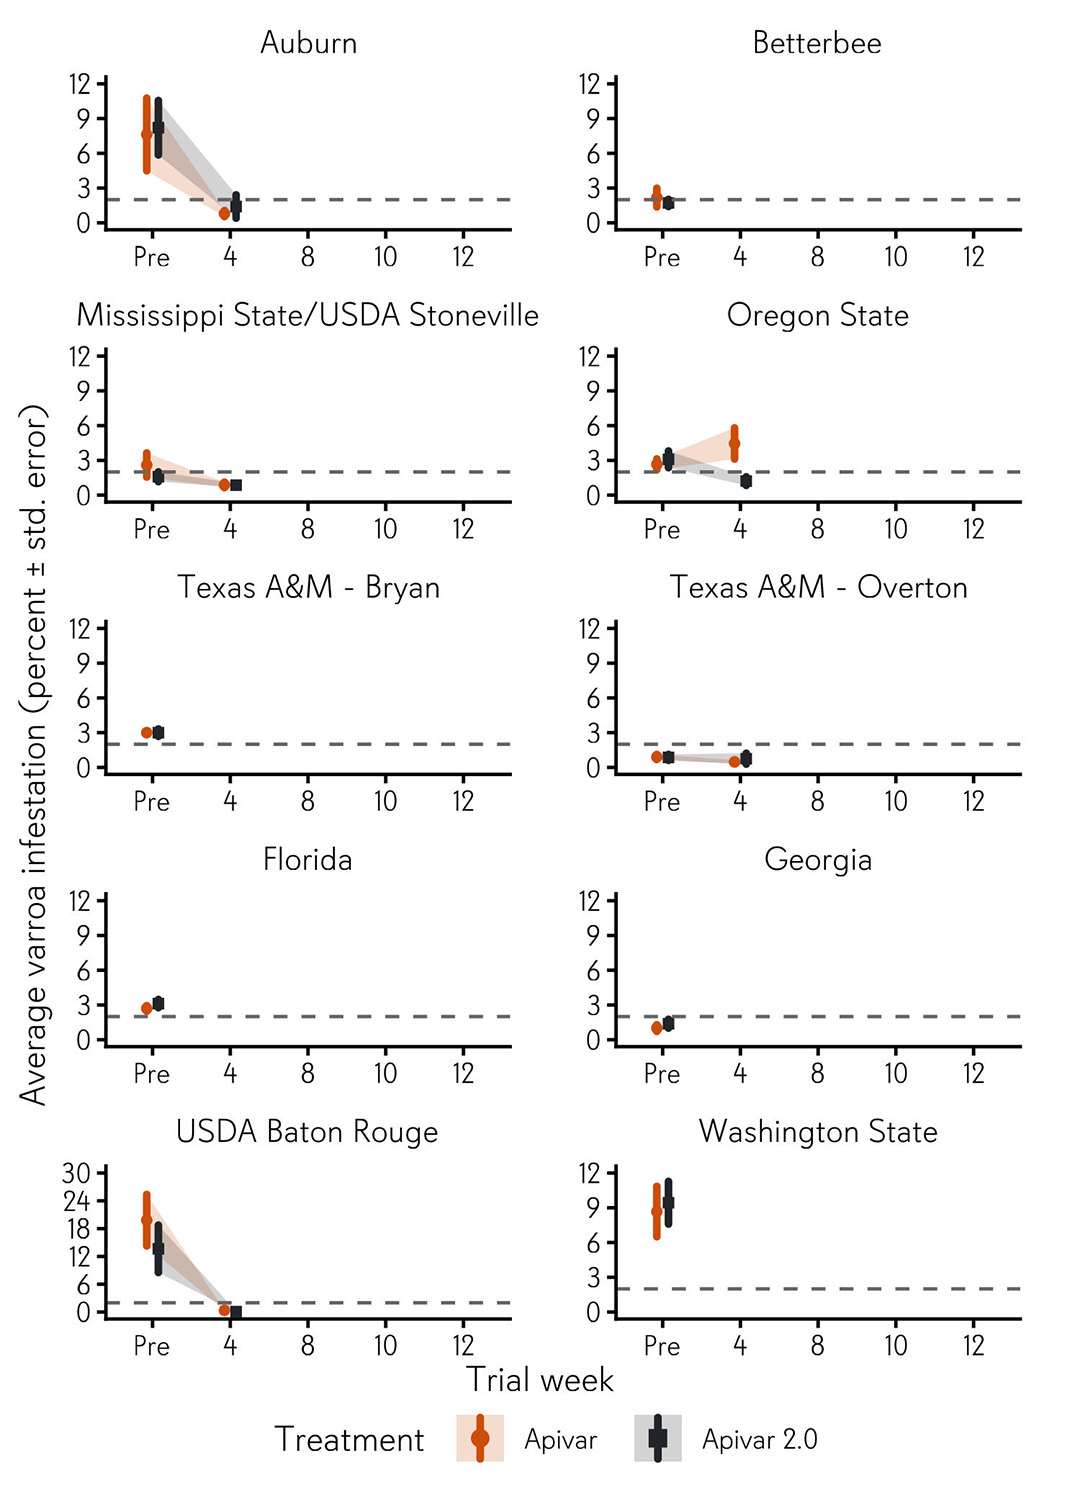
Varroa infestations: We are measuring varroa infestations in Apivar- and Apivar 2.0-treated colonies at several timepoints: before treatment (pre), and at weeks 4, 8, 10, and 12 after treatments were first placed in colonies. Points in the graph below show the average infestations in each group of treated colonies each week, and the vertical lines show the standard error of infestations. The horizontal dashed line represents the 2% treatment action threshold for Fall. Colonies with varroa infestations at or above this threshold should receive a varroa treatment according to the Honey Bee Health Coalition.
Percent of colonies alive
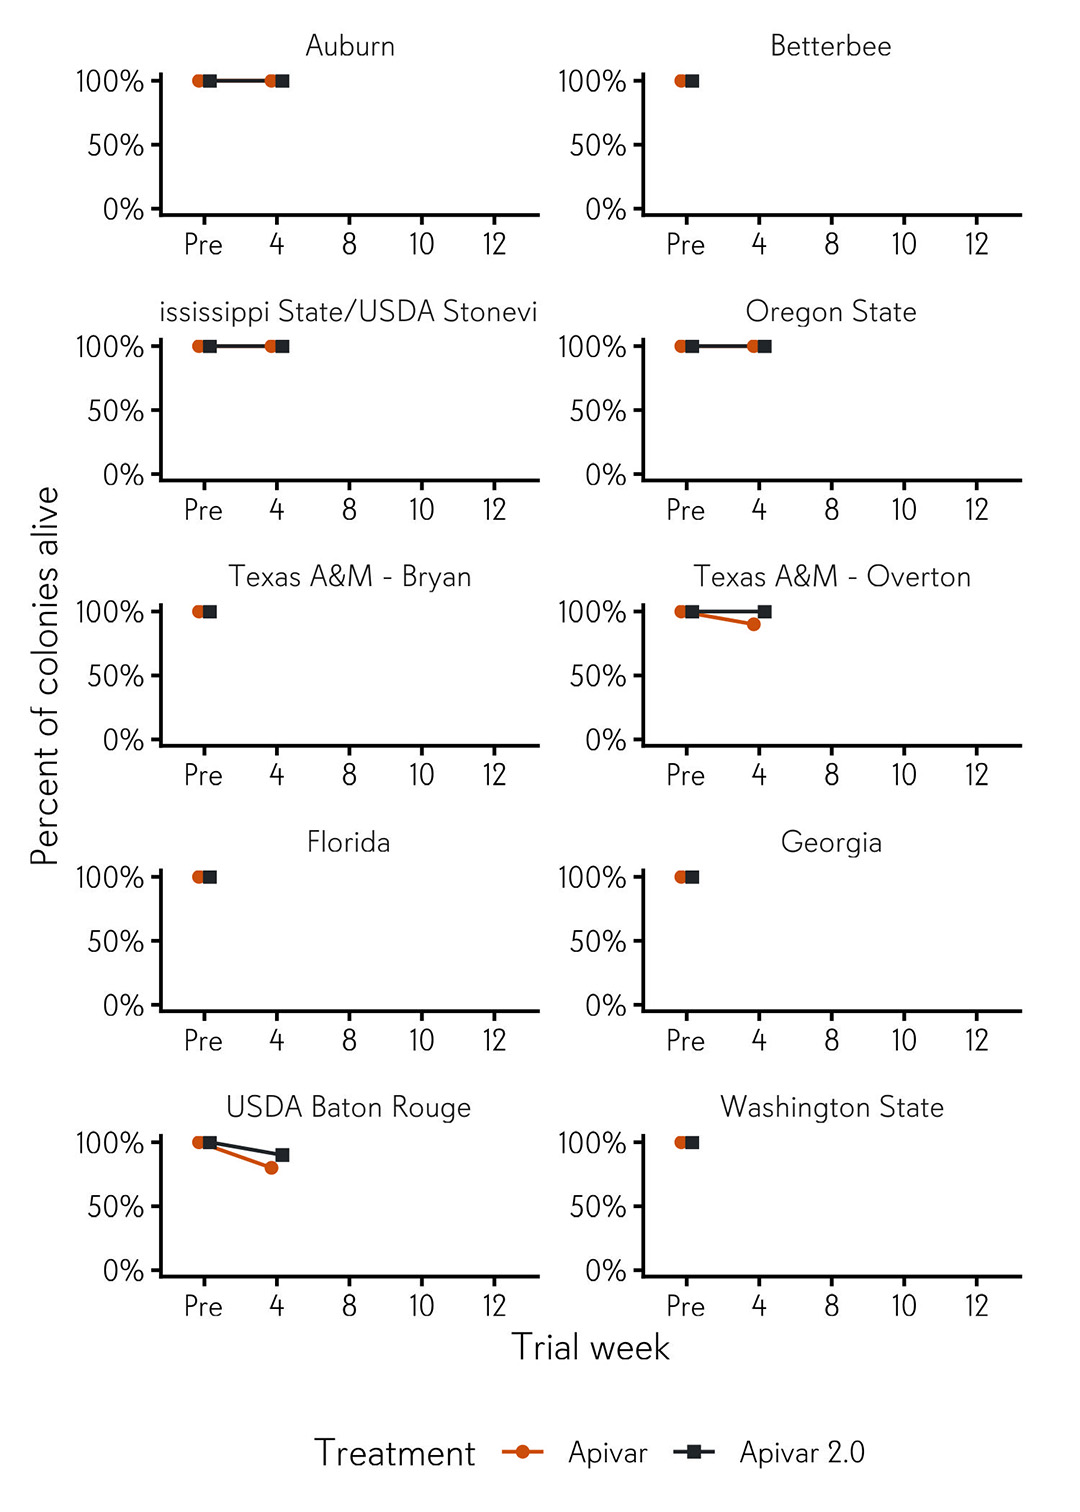
Colony mortality: At each inspection, we are recording whether treated colonies are alive or not. Points in the graph below show the proportion of Apivar- and Apivar 2.0-treated colonies alive in each collaborator's apiaries.
- Auburn University Bee Center
- Betterbee
- Mississippi State University
- USDA-ARS Stoneville
- Oregon State University
- Texas A&M University Honey Bee Lab
- Texas A&M AgriLife Research and Extension – Overton
- University of Florida Honey Bee Research and Extension Lab
- University of Georgia
- USDA-ARS Baton Rouge
- Washington State University
This work is supported by funding through USDA ARS cooperative agreement 59-6066-5-014, USDA NIFA SCRI grant 2023-51181-41246, USDA NIFA Hatch Multi-state NC1173, Southern IPM Center grant 2022-70006-38002, the Alabama Agricultural Experiment Station, and USDA-ARS Stoneville Pollinator Unit Base Funds.


